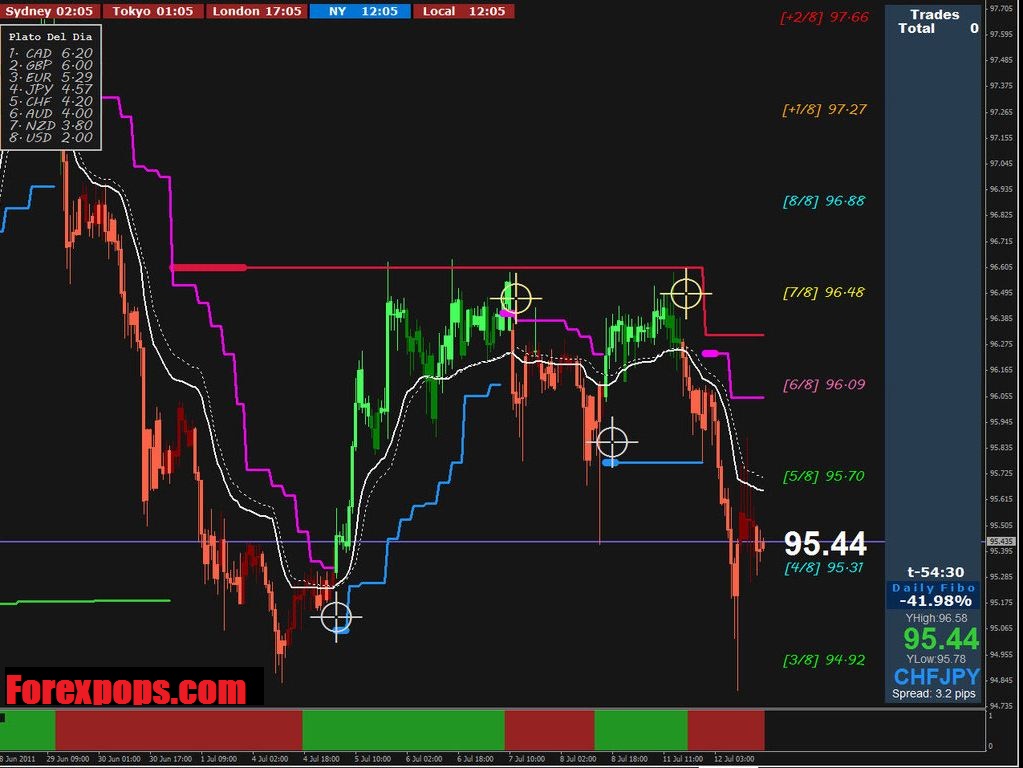
Navigating the dynamic forex market requires a keen understanding of technical indicators that help traders analyze price fluctuations and make informed trading decisions. Among the plethora of indicators available, five key indicators stand out as indispensable tools for forex traders: moving averages, relative strength index (RSI), Bollinger Bands, Ichimoku Kinko Hyo, and Fibonacci retracements. By incorporating these indicators into their trading strategies, traders can enhance their ability to identify trends, spot potential trading opportunities, and manage risk effectively.

Image: forexitem.blogspot.com
1. Moving Averages (MAs)
Moving averages are one of the most widely used technical indicators, providing a smoothed representation of price data over a specified period. They help traders identify trends, support and resistance levels, and potential trading signals. Different types of moving averages, such as simple moving averages (SMAs) and exponential moving averages (EMAs), can be employed based on the trader’s preference and the time frame they are working with.
2. Relative Strength Index (RSI)
The relative strength index (RSI) is a momentum indicator that measures the magnitude of recent price changes to assess whether an asset is overbought or oversold. It oscillates between 0 and 100, with overbought conditions typically indicated by values above 70 and oversold conditions by values below 30. Traders use RSI to identify potential trend reversals, anticipate market corrections, and determine entry and exit points.
3. Bollinger Bands (BBs)
Bollinger Bands are a volatility indicator that consists of three lines: an upper band, a lower band, and a moving average. The bands adapt to changing market conditions, widening when volatility increases and narrowing when volatility decreases. Traders use Bollinger Bands to identify price breakouts, potential reversal points, and overbought or oversold conditions.
4. Ichimoku Kinko Hyo (Ichimoku Cloud)
The Ichimoku Kinko Hyo, also known as the Ichimoku Cloud, is a comprehensive technical indicator that combines multiple time frames and moving averages to provide a holistic view of the market. It consists of several components, including the Ichimoku Cloud, the Tenkan-sen, the Kijun-sen, the Chikou Span, and the Kumo. Traders use Ichimoku Cloud to identify trends, support and resistance levels, and potential trading signals.
5. Fibonacci Retracements
Fibonacci retracements are based on the Fibonacci sequence and are used to identify potential areas of support and resistance in the market. They are drawn by dividing the distance between two significant price points, such as a swing high and swing low, into specific ratios, including 23.6%, 38.2%, 50%, 61.8%, and 78.6%. Traders use Fibonacci retracements to identify potential areas for profit-taking, stop placement, and entry and exit points.
In conclusion, these five major indicators—moving averages, relative strength index (RSI), Bollinger Bands, Ichimoku Kinko Hyo, and Fibonacci retracements—are essential tools for forex traders seeking to enhance their market analysis and decision-making. By mastering these indicators, traders can unlock valuable insights, identify trading opportunities, and make informed trading decisions that can lead to success in the dynamic forex market.

Image: forexpops.com
5 Major Indicators In Forex


