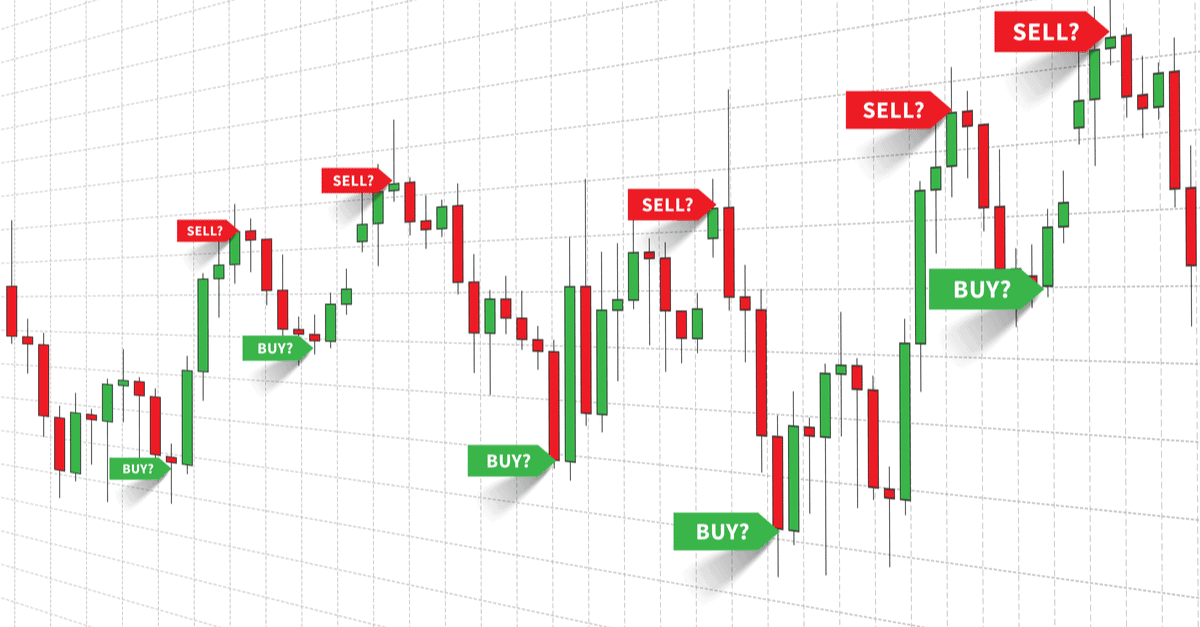
Introduction: Embracing the Art of Japanese Technical Analysis
Picture this: You’re sipping a morning cappuccino at a quaint café, the aroma of freshly brewed coffee filling the air. As you gaze out the window, your eyes catch a glimpse of a flickering candle, its dancing flames mesmerizing. Little did you know that this humble object holds the key to unlocking market secrets in the world of forex trading.

Image: www.forextraders.com
Candlestick patterns, a technique stemming from ancient Japanese rice trading, have become indispensable tools in the arsenal of savvy forex traders. By interpreting these visual formations, traders gain insights into market trends, predict price movements, and make informed decisions that maximize their profits.
Understanding Candlesticks: A Visual Representation of Price Action
Candlesticks are graphical representations of price movements over a specific period. Each candlestick comprises a body and two wicks or shadows. The body, shaded with either green or red, indicates whether prices rose (green) or fell (red) during the period.
Deciphering Candle Length
The length of the body conveys the magnitude of price change. A long, thick body suggests a significant price movement, while a short, narrow body indicates a subdued market.
Interpreting Wicks
Wicks or shadows protruding from the body represent the highest and lowest prices reached during the period. Long wicks imply volatility and potential market uncertainty, whereas short wicks suggest a more stable market environment.

Image: brjavocats.com
Mastering Popular Candlestick Patterns: Identifying Market Sentiment
Candlestick patterns offer a wealth of information about market sentiment and upcoming price movements. Here are some of the most common and reliable:
Bullish Patterns
- Bullish Marubozu: A solid green candlestick with no upper or lower shadows.
- Hammer: A candlestick with a small body at the top of the trading range and a long lower shadow, indicating a potential reversal.
- Engulfing Bullish: A green candlestick that completely engulfs the previous red candlestick, signifying a bullish breakout.
Bearish Patterns
- Bearish Marubozu: A solid red candlestick with no upper or lower shadows.
- Shooting Star: A candlestick with a small body at the bottom of the trading range and a long upper shadow, suggesting a potential reversal.
- Engulfing Bearish: A red candlestick that completely engulfs the previous green candlestick, indicating a bearish breakout.
How To Trade Forex Using Candlestick
Leveraging Candlesticks for Informed Trading Decisions
Candlestick patterns are not mere static indicators; they evolve and interact to provide traders with valuable insights. By observing multiple patterns in conjunction, traders can discern market trends, identify support and resistance levels, and make informed decisions.
For instance, a series of bullish engulfing patterns followed by a bullish marubozu candlestick suggests a strong uptrend is developing. Conversely, a cluster of bearish engulfing patterns culminatin


