

Are you interested in mastering the art of forex trading? If so, understanding daily forex trends is essential for making informed decisions. One of the most effective ways to do this is through the use of daily charts. In this article, we’ll explore how to use daily charts to identify and capitalize on daily forex trends.

Image: forexscalpingtimeframe.blogspot.com
Identifying Trends with Daily Charts
A daily chart is a graphical representation of the price movements of a currency pair over a 24-hour period. It consists of candlesticks, each of which represents the high, low, open, and close prices for that day. By studying daily charts, traders can identify trends, support and resistance levels, and other important patterns that can inform their trading decisions.
Trend Identification
To identify a trend on a daily chart, traders typically use moving averages or trendlines. A moving average is a technical indicator that plots the average price of a currency pair over a specified number of periods. Popular moving averages include the 50-day, 100-day, and 200-day moving averages. When the price moves above or below a moving average, it indicates a trend change.
Trendlines are another way to identify trends. A trendline is a line drawn along a series of highs or lows on a chart. When the price consistently bounces off a trendline, it suggests the presence of a trend.
Support and Resistance Levels
Support and resistance levels are two important concepts in forex trading. Support is a price level at which buyers are willing to step in and buy a currency pair, while resistance is a price level at which sellers are willing to sell. Support and resistance levels can be identified by studying historical price data and identifying areas where the price has repeatedly bounced.
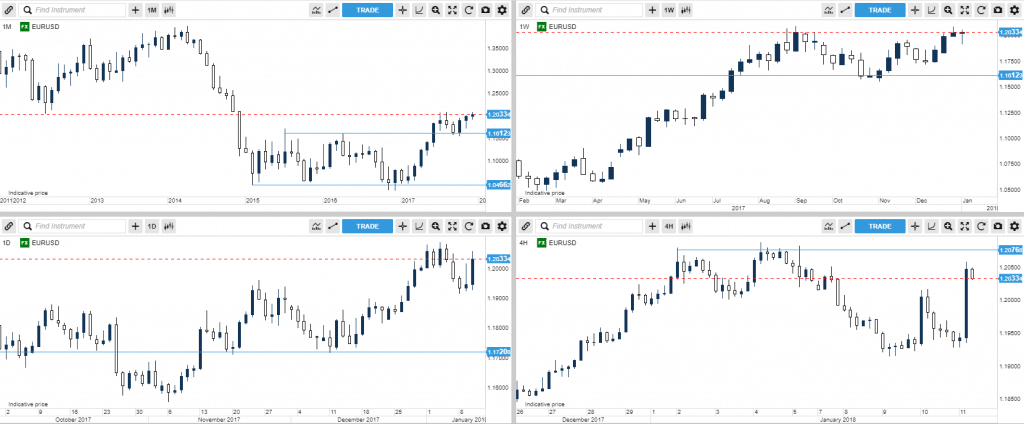
Image: 2ndskiesforex.com
Trading with Daily Charts
Once trends, support, and resistance levels have been identified, traders can use this information to make informed decisions about entering and exiting trades. For example, a trader might enter a long position when the price breaks above a resistance level, or a short position when it breaks below a support level.
It’s important to remember that forex trading carries significant risk, and it’s essential to have a solid understanding of the market before trading. Traders should also use proper risk management techniques, such as setting stop-loss orders and limiting their exposure to leverage.
Tips for Trading with Daily Charts
- Identify the trend: The most important step is to identify the current trend. Don’t fight the trend.
- Use support and resistance levels: Support and resistance levels provide valuable information about where the price might go.
- Be patient: Forex trading is not a get-rich-quick scheme. Be patient and wait for the right opportunities.
- Manage your risk: Set stop-loss orders and limit your exposure to leverage.
FAQs on Forex Trading with Daily Charts
Q: What is the best way to identify trends on a daily chart?
A: Moving averages and trendlines are two common ways to identify trends.
Q: What happens when the price breaks a support or resistance level?
A: A break of a support or resistance level can indicate a change in trend.
Q: How can I improve my chances of success when trading forex?
A: Identify the trend, use support and resistance levels, be patient, and manage your risk.
How To Understand Daily Forex Trend With Daily Chart
Conclusion
Understanding daily forex trends with daily charts is a fundamental skill for any trader. By following the tips outlined in this article, traders can improve their ability to identify trends, support and resistance levels, and make informed decisions about entering and exiting trades. While forex trading carries significant risk, it can also be a rewarding endeavor for those who have taken the time to learn the market and develop a sound trading strategy.


