

Navigating the intricate world of forex trading demands an understanding of how to decipher the enigmatic language of forex charts. These charts serve as the visual roadmaps, guiding traders through the ebbs and flows of currency markets. Embark on this journey with us as we unravel the secrets of forex chart reading, unlocking the path to informed trading decisions.

Image: www.beyond2015.org
A Deeper Dive into Forex Charts: What, Why, and How
What are Forex Charts?
Forex charts are graphical representations of the historical price movements of a currency pair over time. They depict the dynamic relationship between two currencies, showcasing their relative value fluctuations.
Why is Chart Reading Crucial?
Understanding how to read forex charts is pivotal for traders. It empowers them to:
- Identify trends and patterns: Charts reveal the overarching direction of currency movements, helping traders anticipate future price shifts.
- Spot support and resistance levels: These levels indicate areas where the price tends to bounce, providing valuable insights for entry and exit points.
- Make informed trading decisions: Armed with the knowledge gained from chart analysis, traders can make calculated decisions on when to buy, sell, or hold currencies.
How to Read Forex Charts?
Delving into forex charts requires familiarity with three key elements:
- Price Axis: Indicates the value of the currency. It is usually displayed on the left vertical axis.
- Time Axis: Represents the time period over which the chart is plotted. It is usually displayed on the bottom horizontal axis.
- Candlesticks/Bars: Depict the price movements of a currency pair over a specific time interval. The shape and color of these candlesticks convey important information about the market.
The Anatomy of Forex Charts: A Visual Guide
Forex charts consist of various components that provide insights into market behavior:
- Open Price: The price of the currency pair at the start of the time interval.
- Close Price: The price of the currency pair at the end of the time interval.
- High Price: The highest price of the currency pair reached within the time interval.
- Low Price: The lowest price of the currency pair reached within the time interval.
- Wicks (Shadows): The thin lines extending above or below the candlestick’s body, indicating the range of prices during the time interval.
Chart Types: Customizing Your View
Depending on the trader’s preference, various chart types are available, each offering a unique perspective:
- Line Chart: A basic chart type that connects the closing prices of a currency pair, forming a continuous line.
- Bar Chart: Similar to a line chart, but it includes vertical lines (bars) extending from the open to close prices, indicating the price range.
- Candlestick Chart: The most popular chart type, which provides a visually appealing and detailed representation of price movements.
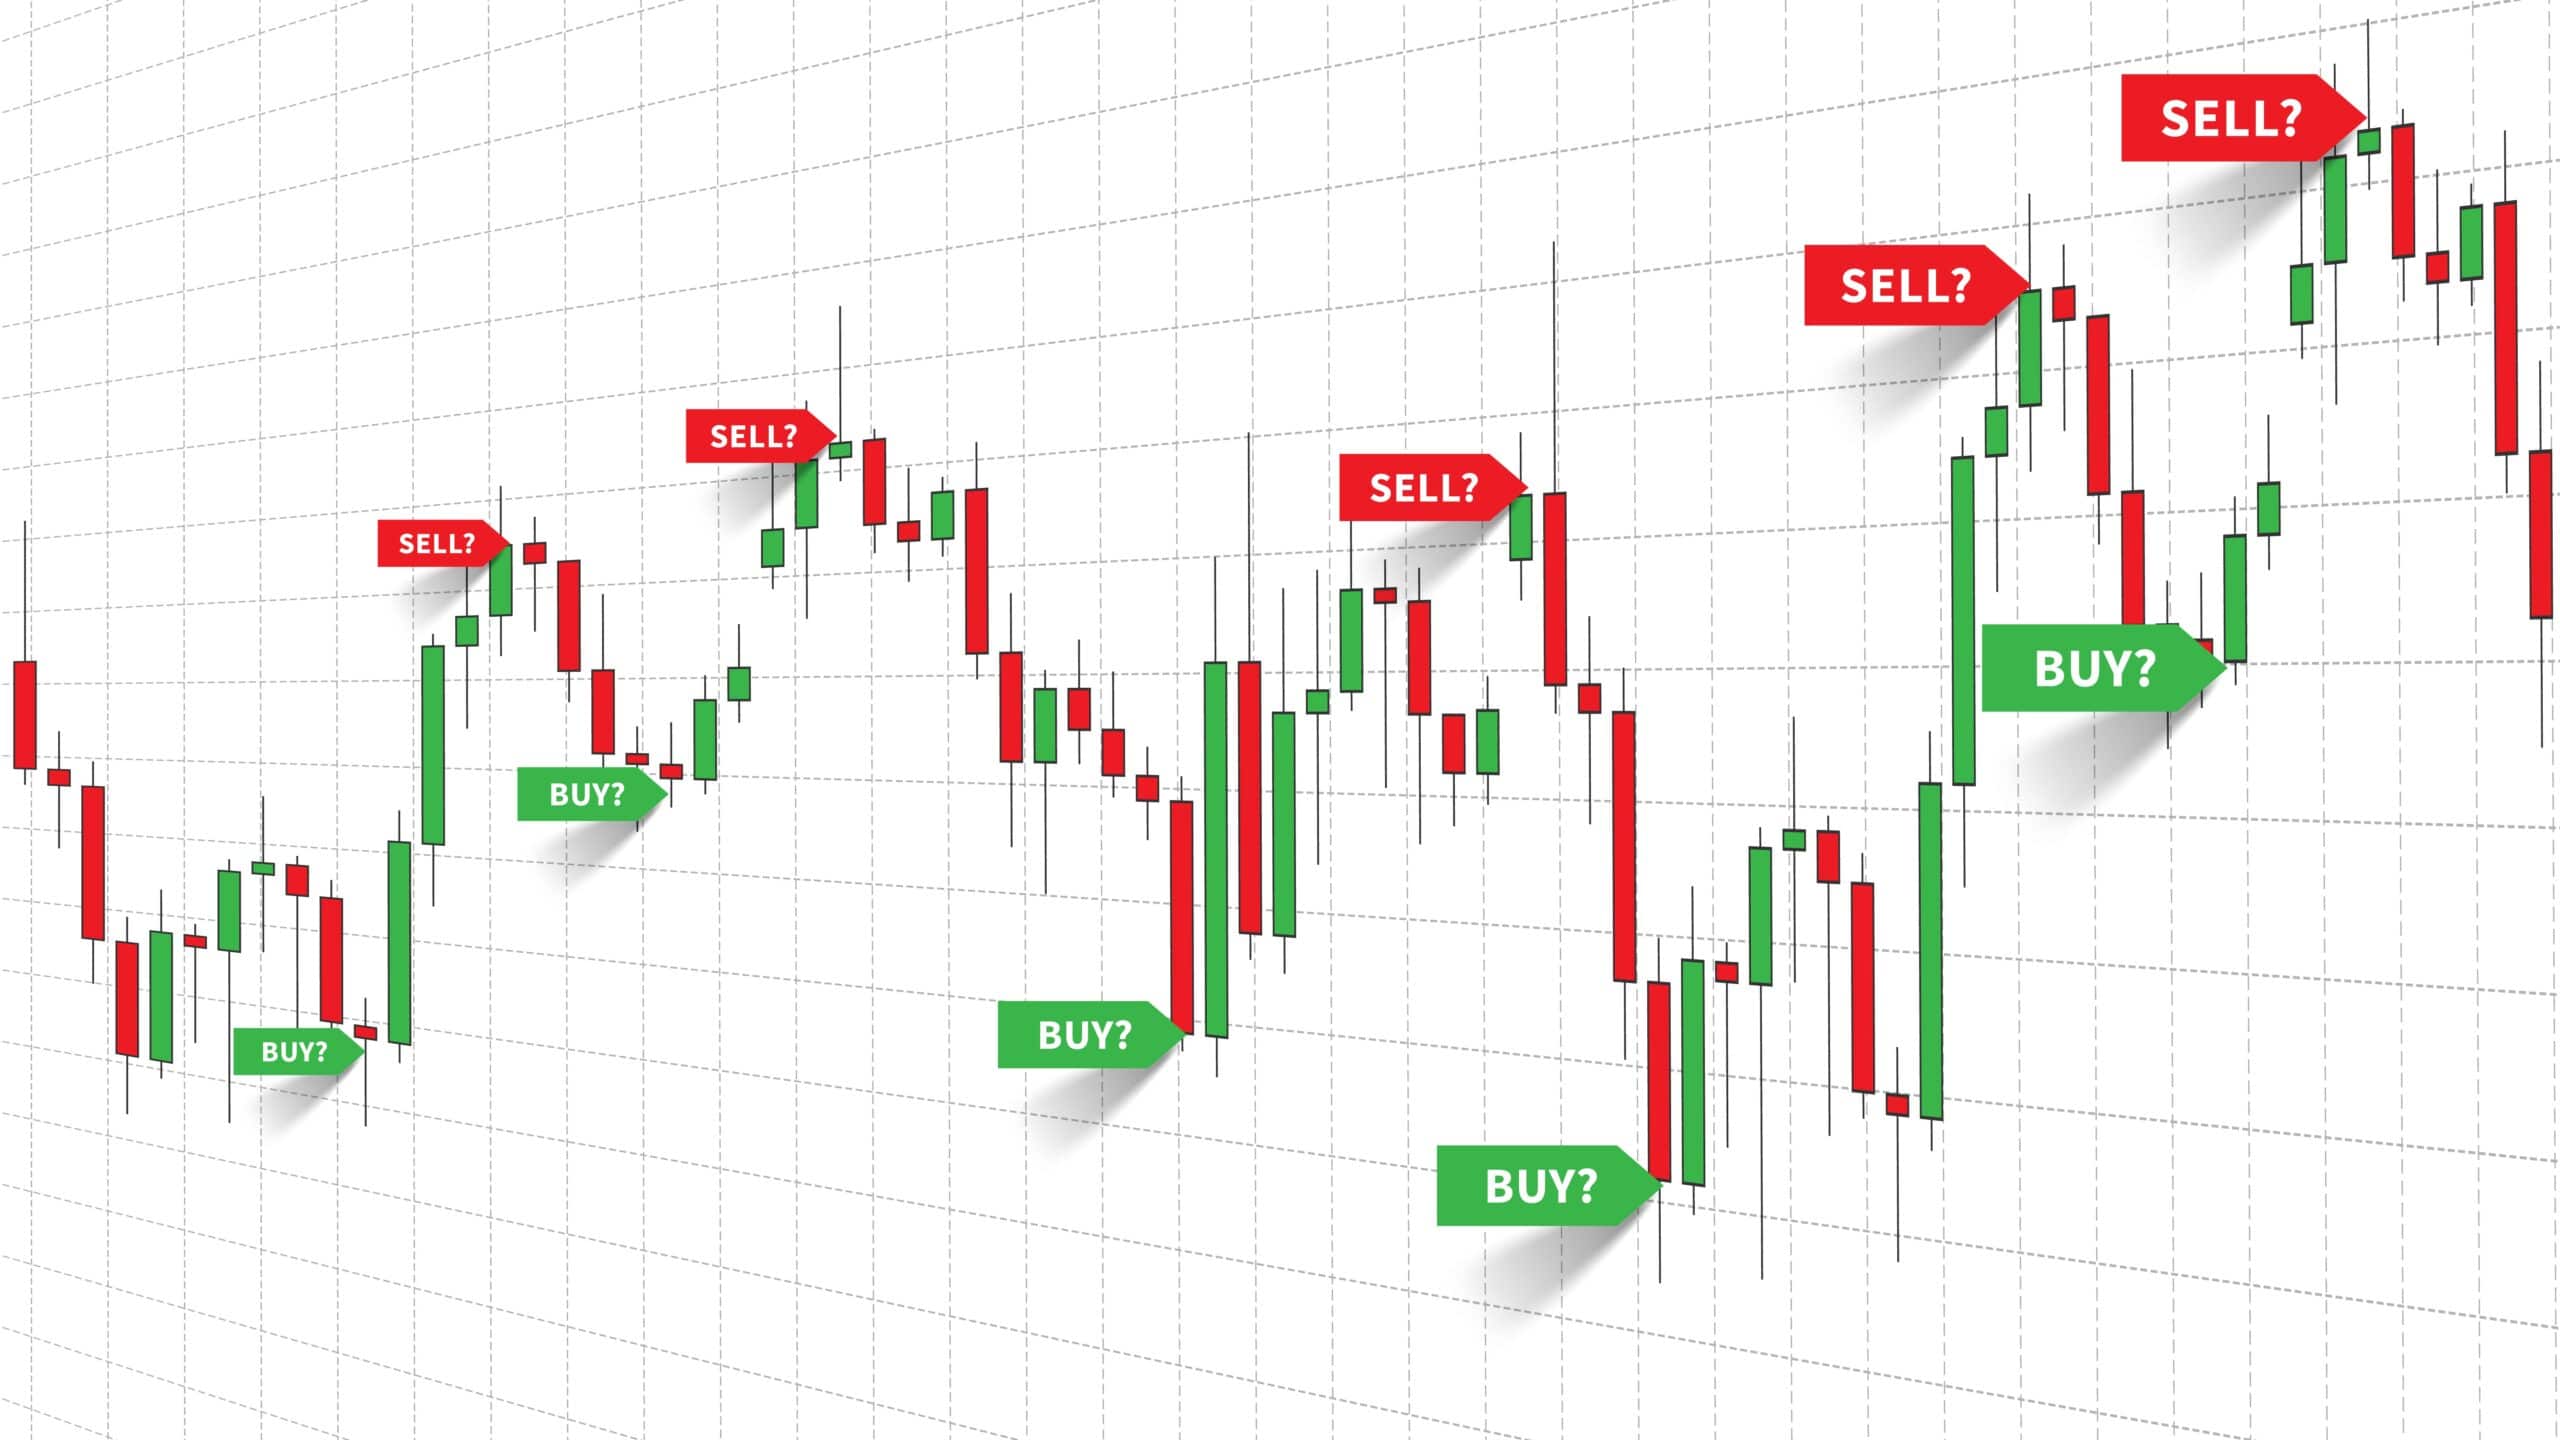
Image: howtotradeonforex.github.io
Trend Analysis: Deciphering Market Momentum
Identifying trends is crucial for assessing the prevailing market sentiment. Trends are categorized as uptrends (prices rising), downtrends (prices falling), or sideways trends (prices moving within a range).
Several technical indicators, such as moving averages and support/resistance levels, help traders confirm and forecast trends.
Pattern Recognition: Uncovering Market Behavior
Forex charts often exhibit recognizable patterns, which can be classified as:
- Continuation Patterns: Indicate that the current trend is likely to continue. E.g., Triangles, Flags, Pennants.
- Reversal Patterns: Suggest that the current trend is likely to reverse. E.g., Double Tops, Double Bottoms, Head and Shoulders.
Expert Tips and Insider Advice
Seasoned forex traders share their wisdom:
- Analyze multiple time frames: Studying charts across different time frames provides a broader perspective of market behavior.
- Use technical indicators sparingly: Indicators can enhance chart analysis, but overusing them can introduce noise and confusion.
- Practice chart reading: The more you practice, the better you will become at identifying patterns and understanding market behavior.
FAQs for Curious Minds
- Q: How often should I check my forex charts?
- A: The frequency depends on your trading strategy. Intraday traders monitor charts more frequently, while swing traders may check less often.
- Q: What is the best type of chart for forex trading?
- A: Candlestick charts are the most popular due to their visual appeal and detailed information.
- Q: Can I rely solely on chart analysis for trading?
- A: While chart analysis is important, it should be combined with other factors such as news events and economic data for informed decisions.
How To Read Forex Chart
Conclusion: Unlock the Forex Enigma
Reading forex charts is an indispensable skill for successful forex trading. By delving into the nuances of candlestick patterns, trends, and support/resistance levels, traders can decipher the market’s hidden language. Armed with this knowledge, they can navigate currency markets with confidence, making informed decisions that maximize their profit potential.
Are you ready to embark on your forex charting journey? Explore our extensive library of articles, webinars, and resources, meticulously crafted to empower you with the knowledge and skills necessary to conquer the world of forex trading.


