Embark on a Journey of Market Mastery with Fibonacci’s Guiding Hand

Image: www.forextrading200.com
In the labyrinthine world of forex trading, where volatility looms at every turn, finding a beacon of clarity is paramount. Fibonacci retracements emerge as a guiding star, illuminating hidden patterns and unlocking the secrets of price behavior. This comprehensive guide will unravel the enigmatic tapestry of Fibonacci retracements, empowering you to navigate the forex markets with precision and confidence.
Unveiling the Fibonacci Legacy
The Fibonacci sequence, a timeless mathematical masterpiece, has captivated the minds of mathematicians, traders, and artists alike. It not only governs the natural world but also holds sway in the realm of finance. The numbers in the sequence (0, 1, 1, 2, 3, 5, 8, 13, 21, 34,…) are formed by adding the two preceding numbers, creating an intricate dance of ratios and proportions.
Fibonacci Retracements: A Bridge between Past and Present
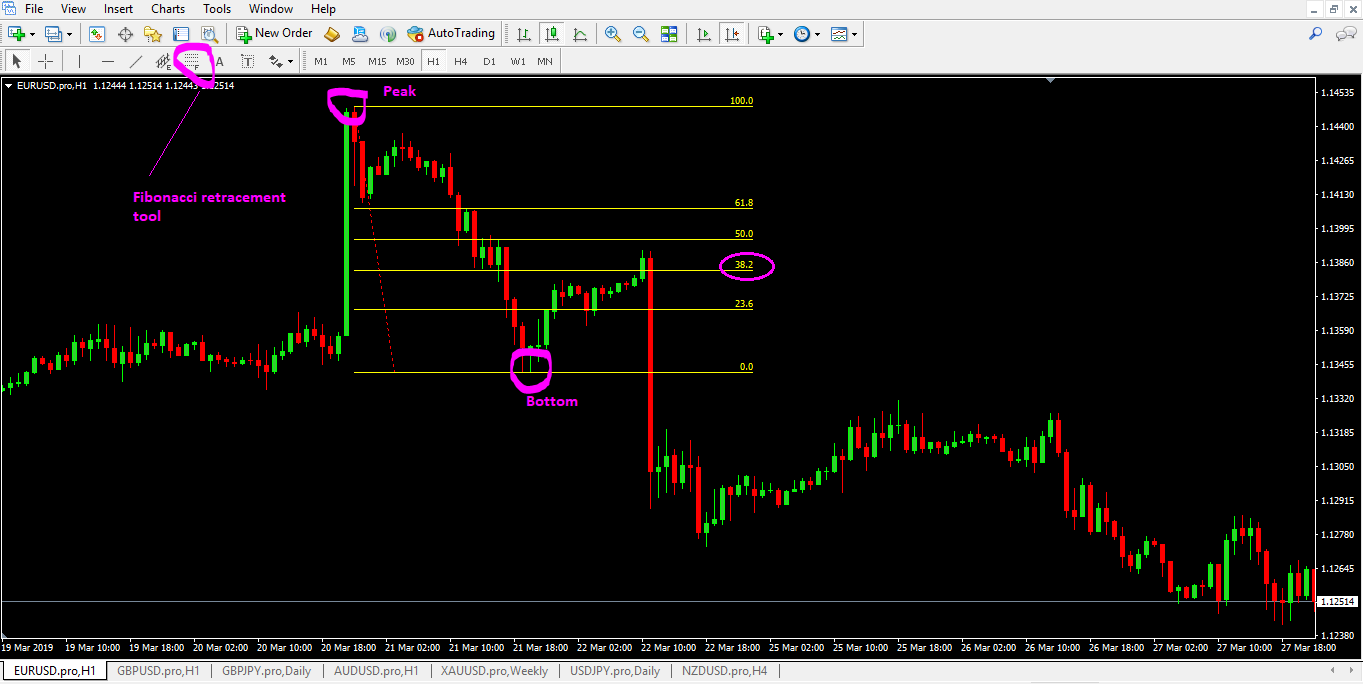
Fibonacci retracements are a technical analysis tool that identifies potential areas of support and resistance based on the Fibonacci sequence. They are plotted as horizontal lines on a price chart, indicating the percentage of a previous market move that is being retraced. These lines, like invisible guide rails, provide critical insights into price action and offer a roadmap for anticipating future price movements.
Demystifying the Key Fibonacci Ratios
The most recognized Fibonacci retracement levels are 23.6%, 38.2%, 50%, 61.8%, and 78.6%. These ratios correspond to specific Fibonacci numbers and have been observed to hold significant significance in market behavior:
- 23.6% (0.236): A minor retracement level indicating a potential pause in the trend.
- 38.2% (0.382): A common support/resistance level that marks a significant retracement of the previous move.
- 50% (0.500): A midpoint retracement level that often signals a temporary equilibrium in the market.
- 61.8% (0.618): A golden ratio that represents a strong support/resistance level and often indicates a significant change in trend.
- 78.6% (0.786): A deep retracement level that marks a point of potential exhaustion in the trend.
Mastering the Art of Fibonacci Retracement Trading
Identifying Fibonacci retracement levels is the key to harnessing their power. Observing how prices behave at these levels can reveal valuable information about support, resistance, and potential trend reversals. Traders can employ retracement levels in conjunction with other technical indicators and candlestick patterns to enhance their trading strategies.
Expert Insights and Actionable Tips
To empower you further, we’ve sought the wisdom of renowned forex experts:
- “Fibonacci retracements are like guideposts on the market’s path. By understanding these levels, you can anticipate potential pauses and changes in trend direction.” – Mark Douglas, Trading Coach
- “Don’t rely solely on Fibonacci retracements. They are a valuable tool, but should be combined with other technical analysis and fundamental research to make informed trading decisions.” – Kathy Lien, FOREX.com Managing Director
Embrace the Power of Fibonacci Retracements
Fibonacci retracements, when used judiciously, can become a powerful weapon in your trading arsenal. They illuminate the unseen forces shaping market movements, enabling you to make informed decisions and navigate the turbulent waters of forex trading with greater confidence. Embark on this journey of market mastery today and unleash the transformative power of Fibonacci’s guiding hand.

Image: www.babypips.com
How To Use Fibonacci Retracement In Forex Pdf


