

Fibonacci retracements are a technical analysis tool that can help investors and traders identify potential areas of support and resistance. They are based on the Fibonacci sequence, a series of numbers in which each number is the sum of the two preceding ones. The most common Fibonacci retracement levels are 23.6%, 38.2%, 50%, 61.8%, and 78.6%. These levels represent potential areas where the price of a security may pause or reverse its trend.

Image: www.satriadaff.com
Fibonacci retracements can be drawn on any chart, but they are most commonly used on price charts. To draw a Fibonacci retracement, first identify the high and low prices of the security over a given period of time. Then, calculate the Fibonacci levels using the following formulas:
- 23.6% retracement = (High – Low) x 0.236
- 38.2% retracement = (High – Low) x 0.382
- 50% retracement = (High – Low) x 0.5
- 61.8% retracement = (High – Low) x 0.618
- 78.6% retracement = (High – Low) x 0.786
Once you have calculated the Fibonacci levels, you can plot them on the chart. The Fibonacci levels will then serve as potential areas of support and resistance. When the price of a security reaches a Fibonacci level, it may pause or reverse its trend. This can be a valuable tool for investors and traders, as it can help them to identify potential trading opportunities.
History of Fibonacci Retracements
Fibonacci retracements are based on the Fibonacci sequence, which was discovered by the Italian mathematician Leonardo Fibonacci in the 13th century. The Fibonacci sequence is a series of numbers in which each number is the sum of the two preceding ones. The first few numbers in the Fibonacci sequence are 0, 1, 1, 2, 3, 5, 8, 13, 21, and 34.
Fibonacci retracements were first used by traders in the early 20th century. They found that the Fibonacci levels could be used to identify potential areas of support and resistance in the price of a security. This information could then be used to make trading decisions.
How to Use Fibonacci Retracements
Fibonacci retracements can be used in a variety of ways. They can be used to identify potential areas of support and resistance, to identify potential trading opportunities, and to manage risk.
To identify potential areas of support and resistance, simply plot the Fibonacci levels on a chart. The Fibonacci levels will then serve as potential areas where the price of a security may pause or reverse its trend. This information can be used to make trading decisions.
To identify potential trading opportunities, look for areas where the price of a security is approaching a Fibonacci level. If the price of a security is approaching a Fibonacci level, it may be a good time to enter a trade. This is because the price of a security is more likely to pause or reverse its trend at a Fibonacci level.
To manage risk, use Fibonacci retracements to identify potential stop-loss levels. A stop-loss level is a price at which you will exit a trade if the price of a security moves against you. By placing your stop-loss level at a Fibonacci level, you can limit your potential losses.
Tips for Using Fibonacci Retracements
Here are a few tips for using Fibonacci retracements:
- Use Fibonacci retracements in conjunction with other technical analysis tools. This will help you to get a more complete picture of the market.
- Don’t rely solely on Fibonacci retracements to make trading decisions. Fibonacci retracements are a valuable tool, but they are not a perfect predictor of the future.
- Use Fibonacci retracements to identify potential trading opportunities and manage risk. Fibonacci retracements can be a valuable tool for investors and traders, but they should be used in conjunction with other technical analysis tools.
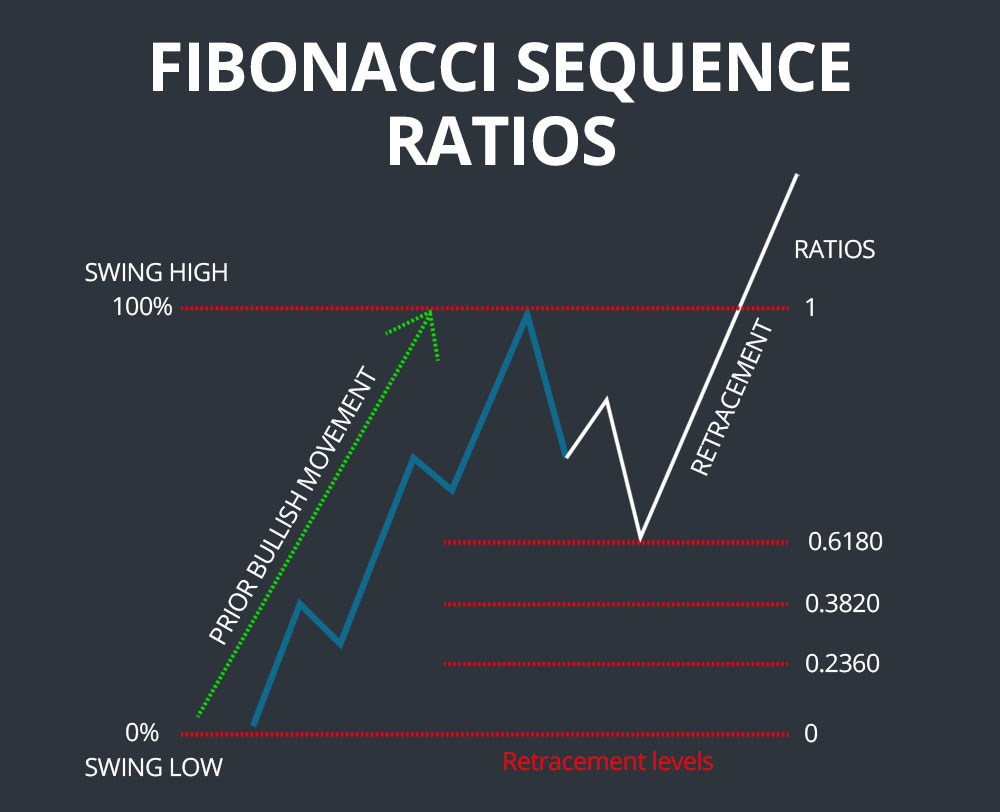
Image: scanz.com
How To Draw Fib Retracement
FAQs About Fibonacci Retracements
Here are a few FAQs about Fibonacci retracements:
- What are Fibonacci retracements?
- Fibonacci retracements are a technical analysis tool that can help investors and traders identify potential areas of support and resistance.
- How do you draw Fibonacci retracements?
- To draw Fibonacci retracements, first identify the high and low prices of the security over a given period of time. Then, calculate the Fibonacci levels using the following formulas:
- 23.6% retracement = (High – Low) x 0.236
- 38.2% retracement = (High – Low) x 0.382
- 50% retracement = (High – Low) x 0.5
- 61.8% retracement = (High – Low) x 0.618
- 78.6% retracement = (High – Low) x 0.786
- How do you use Fibonacci retracements?
- Fibonacci retracements can be used to identify potential areas of support and resistance, to identify potential trading opportunities, and to manage risk.
Are you interested in learning more about Fibonacci retracements? There are a number of resources available online that can help you to get started.


