In the ever-evolving world of forex trading, the ability to decipher market trends holds the key to unlocking profitability. Among the arsenal of technical analysis tools, trendlines stand out as a powerful weapon for charting traders, enabling them to predict future price movements and maximize their trading strategies.

Image: theforexscalpers.com
What are Trendlines?
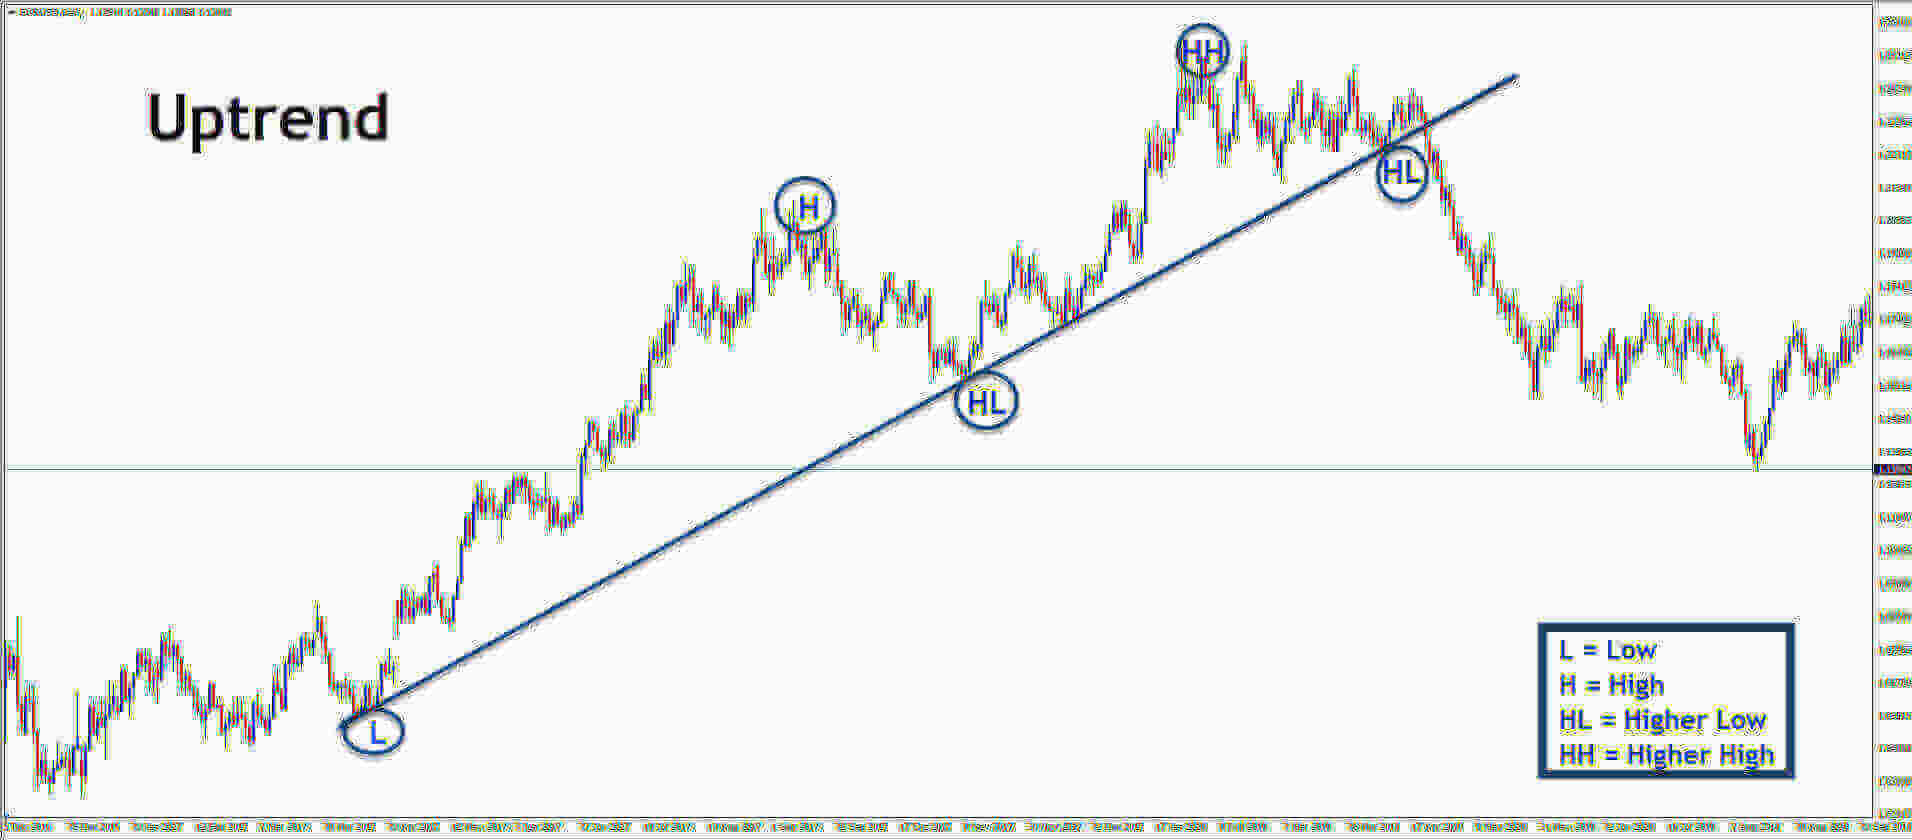
Trendlines are simply lines drawn on a price chart that connect a series of price highs or lows, forming an ascending line for uptrends and a descending line for downtrends. They serve as a visual representation of the overall price momentum and provide crucial insights into market sentiment and support/resistance levels.
The Benefits of Trendline Analysis
Harnessing the power of trendline analysis offers traders numerous advantages in the competitive forex market:
- Identifying market direction: Trendlines help traders determine the prevailing trend, whether bullish or bearish, allowing them to align their trading strategy accordingly.
- Predicting future prices: By analyzing the angle and slope of a trendline, traders can anticipate where price will likely head next, empowering them to make informed trading decisions.
- Setting optimal entry and exit points: Trendlines act as dynamic support and resistance levels, indicating potential price pullbacks and breakouts. This knowledge aids traders in placing trades at optimal points for entry and exit.
- Managing risk: Trendlines provide traders with visual cues to manage risk effectively. Breaking a trendline can signal a reversal, alerting traders to exit trades or adjust their risk parameters.
How to Interpret Trendlines
To effectively interpret trendlines, traders must consider several key factors:
- Price swings: Trendlines should connect the most significant price swings, excluding minor fluctuations. This ensures a robust trendline that represents the underlying price movement.
- Number of touches: The more times a trendline is “touched” by price, the more significant it becomes. Multiple touches indicate a strong trend that traders can rely upon.
- Angle and slope: The angle of a trendline determines the strength of the trend. A steeper trendline indicates a more dynamic trend, while a flatter trendline suggests a weaker trend.
Tips for Effective Trendline Trading
Mastering the art of trendline trading requires attention to these practical tips:
- Confirm the trend: Always look for multiple highs or lows to confirm the established trend before drawing a trendline.
- Avoid false signals: Be cautious of trendlines drawn based on a few price points, as they may not represent the true trend.
- Consider multiple time frames: Analyze the same currency pair across various time frames (e.g., 1-hour, 4-hour, daily) to gain a holistic perspective on the trend.
- Use Fibonacci retracement levels: Combine trendline analysis with Fibonacci retracement levels to identify potential support and resistance zones.
- Be adaptive: Trendlines can shift over time, so it’s crucial to monitor them regularly and adjust as necessary to stay in sync with market movements.
Conclusion
Trendline analysis is an indispensable tool in the forex trader’s arsenal, providing valuable insights into market direction, price prediction, and risk management. By understanding how to draw and interpret trendlines, traders can elevate their trading strategies, anticipate market movements more effectively, and ultimately increase their chances of success in the dynamic world of forex trading.

Image: www.dailyfx.com
How To Use Trendline In Forex
https://youtube.com/watch?v=TvsCB6R8ydw


