Introduction:

Image: forexprofitway.com
In the ever-evolving landscape of Forex trading, technical indicators have become an indispensable tool for traders seeking an edge in the volatile currency market. Among the various technical indicators, trendline indicators stand out as an effective tool for identifying trends and predicting potential price movements. This comprehensive guide will delve into the world of trendline forex indicators, outlining their significance and empowering you with the knowledge to utilize them effectively in your trading strategy.
Defining Trendline Forex Indicators:
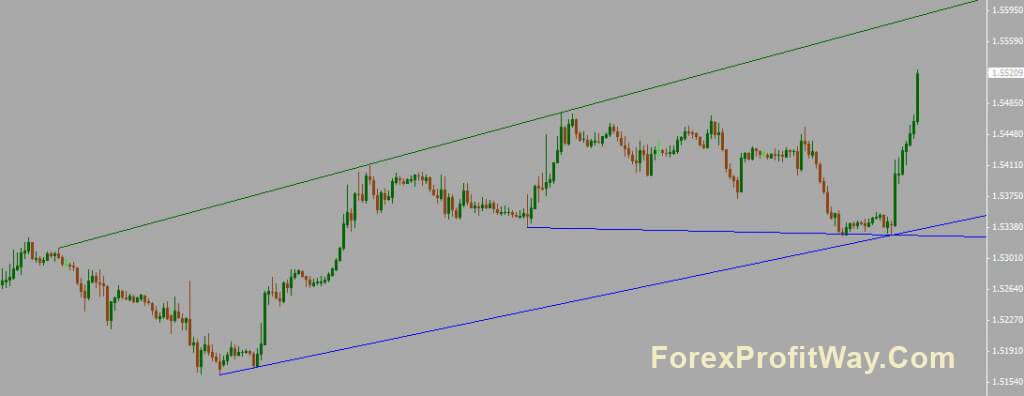
Trendline indicators are a versatile tool used to identify the overall direction of a currency pair’s price over time. They are constructed by connecting a series of consecutive higher or lower price points, forming an upward or downward sloping line, respectively. The slope of the trendline provides valuable insights into the strength and momentum of the underlying trend, aiding traders in making informed decisions.
Why Use Trendline Indicators?
Trendline indicators offer several compelling advantages for Forex traders. Their ability to:
- Identify Trends: Trendlines simplify price action, making it easier to spot and understand the direction and strength of the current market trend.
- Predict Price Movements: By extrapolating the trendline, traders can anticipate potential price movements and stay ahead of the market.
- Set Stop-Loss and Take-Profit Points: Trendlines provide logical levels for placing stop-loss and take-profit orders, minimizing risk and maximizing profit potential.
- Confirm Market Sentiment: The slope and direction of the trendline serve as a visual representation of market sentiment, helping traders to align their trading strategies.
Types of Trendline Indicators:
- Up Trendlines: These indicators connect a series of higher lows, indicating a positive upward trend.
- Down Trendlines: They connect a series of lower highs, signaling a downward decline in the market.
- Horizontal Trendlines: These indicators form when the price moves sideways, creating a horizontal line that represents support or resistance levels.
- Channel Trendlines: By combining up and down trendlines parallel to each other, channel trendlines create a range or channel in which the price is expected to move.
Free Download of Trendline Forex Indicators:
Numerous online resources offer free downloads of trendline forex indicators compatible with popular trading platforms such as MetaTrader 4 and MetaTrader 5. These indicators provide real-time trendline analysis and can be seamlessly integrated into your trading setup.
How to Use Trendline Indicators:
- Identify the Trend: Draw a trendline connecting the relevant highs or lows to identify the market’s general direction.
- Analyze the Slope: A steeper slope indicates a stronger trend and greater potential for further movement in that direction.
- Watch for Breakouts: When the price crosses the trendline, it signals a potential breakout and a potential trend reversal.
- Plot Support and Resistance: Identify support levels on uptrend lines and resistance levels on downtrend lines as potential areas for market reactions.
- Confirm with Other Indicators: Combine trendline analysis with other technical indicators for increased accuracy and reliability.
Conclusion:
Trendline Forex indicators are a powerful tool that can significantly enhance a trader’s ability to analyze market trends and make informed decisions. By understanding the principles and practical applications of trendline indicators, traders can unlock the potential to improve their trading performance

Image: www.dolphintrader.com
Forex Indicator Free Download In Trendline


