

Introduction
Trading in the foreign exchange (forex) market is a global endeavor that involves the buying and selling of currencies. Forex traders seek to capitalize on the price movements of currency pairs, which are influenced by various factors such as economic data, geopolitical events, and market sentiment. Trend lines are a powerful technical analysis tool that can help traders identify potential trading opportunities and make informed decisions.

Image: mungfali.com
Trend lines are graphical representations of a currency pair’s price trajectory, depicting either an uptrend or a downtrend. By connecting two or more significant price points on a chart, traders can determine the overall direction of the market and make predictions about future price movements. Drawing trend lines effectively requires an understanding of different types of trend lines, their significance, and how to use them in conjunction with other technical indicators.
Types of Trend Lines
Uptrend Lines
Uptrend lines are drawn by connecting two or more higher lows, forming an upward slant. They indicate a bullish market, where the demand for a currency is increasing relative to its supply. Traders can use uptrend lines to identify potential buying opportunities, as breakouts above the line suggest a continuation of the uptrend.
Downtrend Lines
Downtrend lines are drawn by connecting two or more lower highs, forming a downward slant. They indicate a bearish market, where the supply of a currency is increasing relative to its demand. Traders can use downtrend lines to identify potential selling opportunities, as breakouts below the line suggest a continuation of the downtrend.
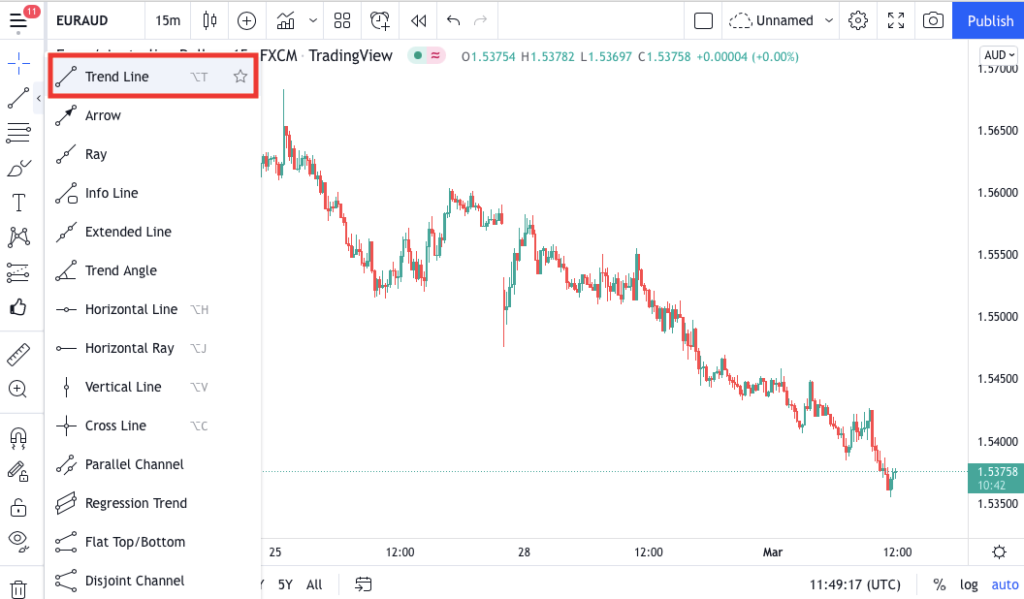
Image: forexspringboard.com
Horizontal Trend Lines
Horizontal trend lines are drawn parallel to the x-axis, connecting two or more price points at the same level. They indicate a period of consolidation, where the supply and demand for a currency are roughly balanced. Traders can use horizontal trend lines to identify potential support and resistance levels.
Significance of Trend Lines
Trend lines provide traders with valuable insights into the market’s momentum and potential price movements. They can be used to:
- Identify Support and Resistance Levels: Trend lines act as support or resistance levels, indicating potential areas where the market may find support or face resistance. Breakouts above or below a trend line can signal a change in market sentiment.
- Predict Price Movements: Trend lines help traders predict the future direction of the market. By analyzing the slope and trajectory of a trend line, traders can determine whether the trend is likely to continue or reverse.
- Identify Trading Opportunities: Trend lines provide potential entry and exit points for trades. Traders can buy above an uptrend line or sell below a downtrend line, aiming to capitalize on the market’s momentum.
- Manage Risk: Trend lines can be used to define stop-loss levels, which help traders limit their losses in the event that the market moves against their position.
How to Draw Trend Lines
Drawing trend lines is a straightforward process that involves identifying key price points on a chart. Here are the steps:
- Choose a Chart: Select a currency pair and time frame that you want to analyze.
- Identify Swing Points: Swing points are the highest and lowest points in a price series. A swing high is a local maximum, while a swing low is a local minimum.
- Connect Swing Points: Draw a line connecting two or more swing highs for an uptrend line or two or more swing lows for a downtrend line.
- Adjust the Line: Extend the trend line until it touches the price bars or until it becomes invalidated by a breakout.
- Horizontal Trend Lines: Draw a horizontal line connecting two or more price points at the same level.
Combining Trend Lines with Other Indicators
Trend lines are a versatile tool that can be combined with other technical indicators to enhance trading strategies. Some common combinations include:
- Moving Averages: Moving averages smooth out price fluctuations and provide a visual representation of the market’s trend. They can be used to confirm or negate trend lines.
- Oscillators: Oscillators measure the momentum and volatility of the market. They can be used to identify potential reversals in the trend or overbought/oversold conditions.
- Volume: Volume indicates the number of contracts traded over a given period. High volume can confirm the strength of a trend line breakout.
Drawing Trend Lines Forex Pdf
Conclusion
Drawing trend lines in forex is an invaluable skill for traders of all levels. By understanding the different types of trend lines, their significance, and how to draw them effectively, traders can gain valuable insights into the market’s momentum and potential price movements. Combined with other technical indicators, trend lines provide a comprehensive approach to technical analysis, enabling traders to make informed decisions and improve their trading results.


