Introduction:

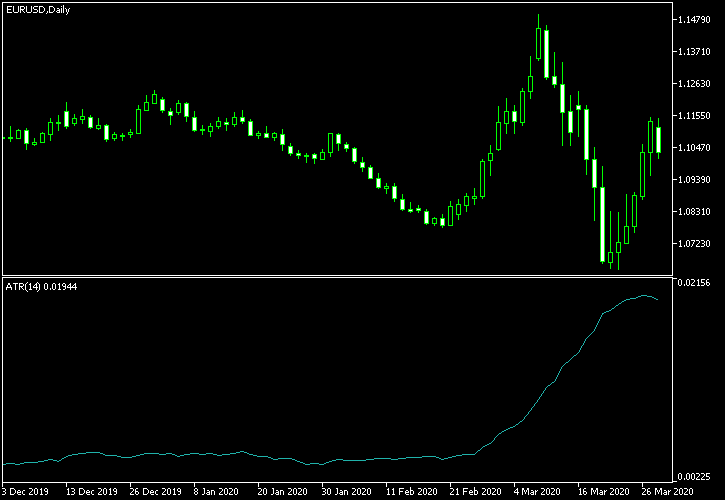
Image: www.earnforex.com
In the ever-changing realm of forex trading, volatility reigns supreme as a key factor determining risk and reward. Navigating this dynamic market requires traders to understand how to calculate volatility ratio, a crucial metric that measures the magnitude of price fluctuations. By harnessing the power of volatility ratio, traders gain a competitive edge in assessing market dynamics and making informed decisions. This comprehensive guide will empower you with the knowledge and skills to effectively calculate volatility ratio in forex, opening doors to enhanced trading strategies and heightened profitability.
Understanding Volatility Ratio:
Volatility ratio, often referred to as the “coefficient of variation,” is a statistical measure that quantifies the relative variation in the price of a currency pair over a specified period. Expressed as a percentage, it reflects the standard deviation of price changes divided by the average price. A high volatility ratio indicates significant price fluctuations, while a low ratio signals a more stable market. Understanding volatility ratio is essential for traders to gauge market risk and adjust their trading strategies accordingly.
Historical Volatility vs. Implied Volatility:
When discussing volatility ratio in forex, it’s crucial to differentiate between historical volatility and implied volatility. Historical volatility measures the actual price fluctuations that have occurred in the past, providing a retrospective view of market behavior. Implied volatility, on the other hand, gauges market expectations of future volatility based on option pricing. While historical volatility offers insights into past trends, implied volatility serves as a forward-looking indicator of potential price movements.
Calculating Volatility Ratio:
Calculating volatility ratio in forex involves a straightforward formula:
Volatility Ratio = (Standard Deviation / Average Price) x 100
To determine the standard deviation, traders can utilize historical price data. By calculating the standard deviation of price changes over a specific period, such as 30 days or 60 days, they can quantify the typical price fluctuations. Subsequently, to find the average price, traders simply add up the daily closing prices over the chosen period and divide by the number of days. The resulting volatility ratio provides a comprehensive assessment of market volatility.
Interpretation and Use:
Once calculated, the volatility ratio empowers traders to make informed decisions. A high volatility ratio signals a market characterized by significant price swings, indicating potential opportunities for profit but also heightened risk. Such markets necessitate caution, as rapid price fluctuations can lead to sharp losses. Conversely, a low volatility ratio suggests a more stable market with smaller price movements. This stability offers greater predictability but potentially lower profit margins.
Traders can utilize volatility ratio to gauge their risk tolerance and adjust their trading strategies accordingly. Those comfortable with higher risk may opt for currency pairs with higher volatility ratios, aiming to capitalize on larger price fluctuations. Alternatively, risk-averse traders may prefer currency pairs with lower volatility ratios, seeking more predictable market conditions.
Dynamic Volatility and Trading Strategies:
Volatility ratio is not static and can vary over time. Economic news, political events, and market trends can significantly influence market volatility. It is crucial for traders to be aware of these factors and monitor volatility ratio regularly to adapt their trading strategies. A sudden spike in volatility, for instance, may warrant a reduction in position size or a shift to lower-risk currency pairs.
Case Study:
To illustrate the practical application of volatility ratio, let’s consider an example. Suppose we are analyzing the EUR/USD currency pair over a 30-day period. During this period, the daily closing prices ranged from 1.1650 to 1.1750. The standard deviation of price changes over this period was $39. Calculating the average price as ($1.1650 + $1.1750)/2 = $1.17, the volatility ratio for the EUR/USD pair over the 30-day period is:
Volatility Ratio = (39 / 1.17) x 100 = $3.33%
This volatility ratio indicates moderate price fluctuations for the EUR/USD pair, suggesting a relatively stable but potentially profitable market. Based on this assessment, traders may consider implementing a trading strategy that favors stable market conditions, utilizing technical analysis to identify high-probability trading opportunities within the existing volatility range.
Conclusion:
In conclusion, calculating volatility ratio in forex is a vital skill that empowers traders to assess market dynamics and refine their trading strategies. The formula for volatility ratio, its interpretation, and its dynamic nature are critical concepts for successful forex traders. By leveraging this knowledge, traders can navigate the ever-changing forex markets with enhanced confidence, making informed decisions that maximize profit potential while effectively managing risk.
Remember, the pursuit of knowledge is an ongoing journey. Continuous education, informed decision-making, and adapting to changing market conditions are essential elements for success in the competitive world of forex trading.

Image: axaryje.pev.pl
How To Calculate Volatility Ratio In Forex


