Introduction
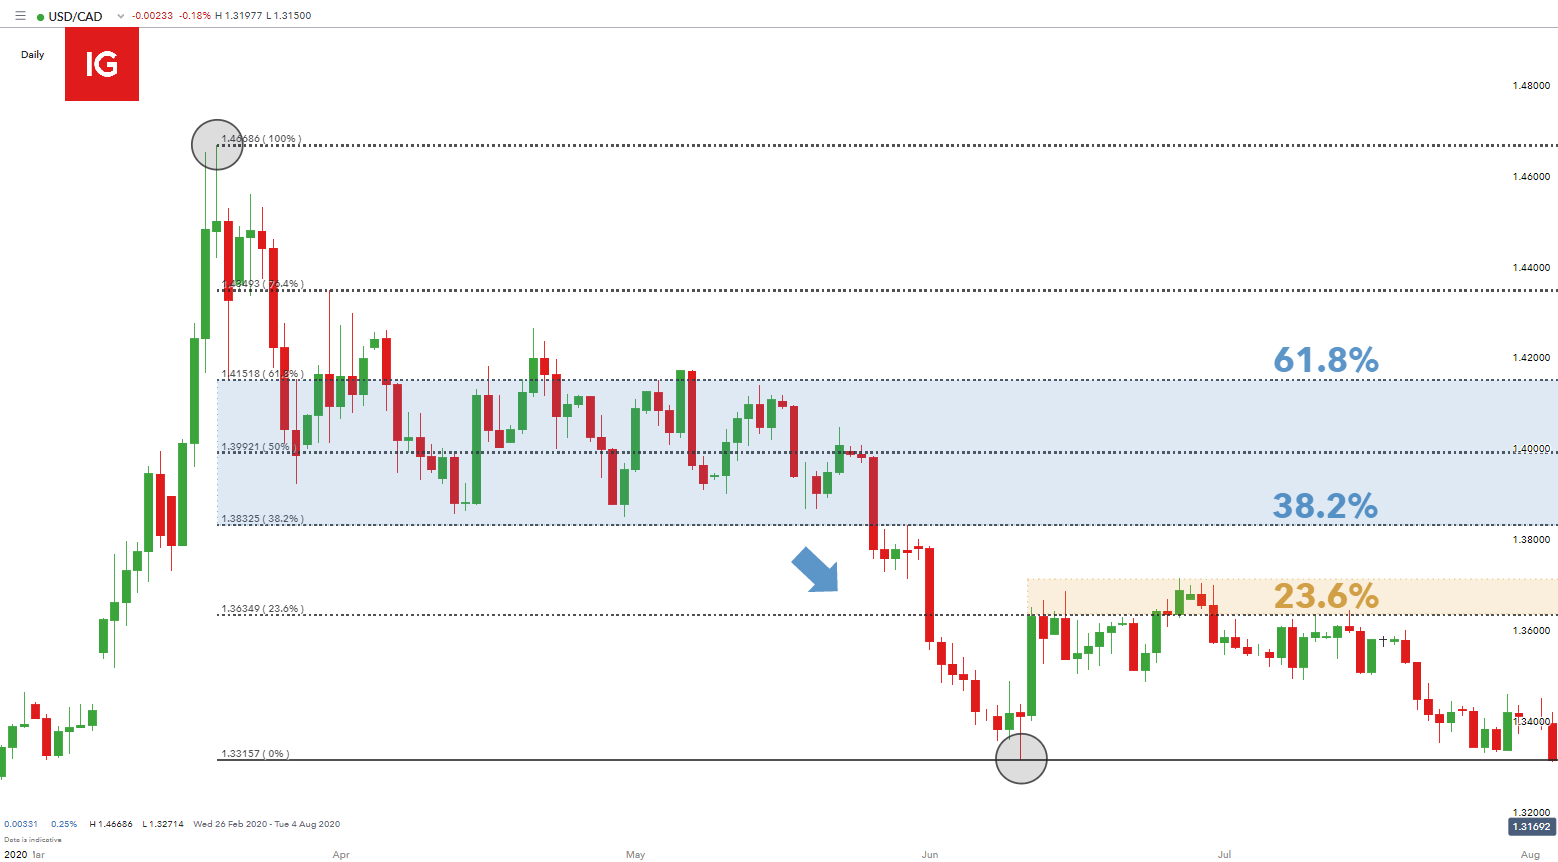
In the ever-evolving world of forex trading, technical analysis plays a crucial role in helping traders make informed decisions. Among the various technical analysis tools, Fibonacci retracements stand out as a powerful tool for predicting potential price movements. This article delve into the intricate world of Fibonacci retracements, providing a comprehensive understanding of their concept, application, and interpretation in Forex trading.

Image: community.ig.com
Understanding Fibonacci Retracements
Fibonacci retracements are based on the Fibonacci sequence, a series of numbers in which each number is the sum of the two preceding ones (e.g., 0, 1, 1, 2, 3, 5, etc.). When applied to forex charts, Fibonacci retracements identify potential areas of support and resistance, as well as areas where price may reverse or retrace. These levels are expressed as percentages of the most recent price swing, typically ranging from 23.6% to 78.6%.
How to Draw Fibonacci Retracements
-
Identify the most recent price swing: Mark the highs and lows of the most recent price movement. For an uptrend, the swing low and swing high will be used, while for a downtrend, the swing high and swing low will be used.
-
Calculate the Fibonacci levels: Use the following formula to calculate the key Fibonacci levels:
- 23.6% = (Swing Low – Swing High) * 0.236
- 38.2% = (Swing Low – Swing High) * 0.382
- 50.0% = (Swing Low – Swing High) * 0.500
- 61.8% = (Swing Low – Swing High) * 0.618
- 78.6% = (Swing Low – Swing High) * 0.786
-
Plot the Fibonacci levels: Horizontally drag the calculated levels onto the price chart, marking the areas of potential support and resistance.
Interpreting Fibonacci Retracements
Once Fibonacci retracements have been drawn, traders can interpret them to identify potential trading opportunities. When the price reaches a Fibonacci level, it may experience a pause or reversal. This is because market psychology often causes traders to anticipate retracements to these levels and react accordingly.
- Support levels: The 23.6% and 38.2% levels represent areas where a downward price trend may find support and reverse upward.
- Resistance levels: The 50.0%, 61.8%, and 78.6% levels represent areas where an upward price trend may encounter resistance and reverse downward.

Image: www.youtube.com
Trading Strategies Using Fibonacci Retracements
1. Buying at Support Levels
When price reaches a support level (e.g., 23.6% or 38.2%) in an uptrend, traders may consider buying with the expectation that the trend will continue.
2. Selling at Resistance Levels
When price reaches a resistance level (e.g., 61.8% or 78.6%) in a downtrend, traders may consider selling with the expectation that the trend will reverse.
3. Scalping with Fibonacci Retracements
Fibonacci retracements can also be used in scalping strategies. For instance, traders may place a buy stop order just above a support level or a sell stop order just below a resistance level and exit the trade when price reaches the next Fibonacci level.
Forex How To Draw Fibonacci
Conclusion
Fibonacci retracements are a powerful tool for forex traders, providing insights into potential areas of support, resistance, and trend reversals. By understanding the concept of Fibonacci retracements and applying them effectively, traders can enhance their technical analysis and make more informed trading decisions. It’s important to remember that while Fibonacci retracements can provide valuable guidance, they are not foolproof and should always be used in conjunction with other technical indicators and market conditions.


